
This post is part of “Progressive Delivery” series.
- Introduction to Progressive Delivery
- Practical Progressive Delivery with Argo Rollouts - Setup
- Practical Progressive Delivery with Argo Rollouts - BlueGreen
- Practical Progressive Delivery with Argo Rollouts - Canary
- Practical Progressive Delivery with Argo Rollouts - Auto rollback with metrics (this post)
Table of Contents:
- Background
- Prerequisite
- Install Prometheus to the Kubernetes cluster
- Deploy demo application
- Conclusion
Background
In the previous post, we learned how to do Canary deployment with Argo Rollouts. In this post, we will learn how to automatically rollback a bad deployment using Prometheus metrics.
In Argo Rollouts, using a metric to progress or rollback the deployment is called “Analysis”. It supports many Kubernetes metrics consolidation software (See Argo Rollouts Analysis for more detail). We will use “Prometheus”, the most popular Kubernetes metrics aggregation software, in this post.
You can also learn more about Argo Rollouts in this post.
Prerequisite
- A Kubernetes cluster and client cli tools (Follow this post)
- Argo Rollouts installed (Follow this post)
- Make sure that you clone this repository (if not done already) into your computer.
git clone https://github.com/pongsatt/k3s-argo-rollouts.git
cd k3s-argo-rollouts
Install Prometheus to the Kubernetes cluster
We will use “Prometheus Operator” helm chart from bitnami (kube-prometheus).
Install it using.
helm repo add bitnami https://charts.bitnami.com/bitnami
kubectl create ns prometheus

helm upgrade -i -n prometheus kube-prometheus bitnami/kube-prometheus
Note.
Prometheus operator allows us to configure what metrics we want to scrape using a custom resource “ServiceMonitor”. This is more convenient and flexible comparing to configure directly to the Prometheus server.
Then, we need to enable NGINX ingress service monitoring for Prometheus operator. If you followed the “Argo Rollouts setup”, it’s already done.
If not, execute this command to enable the NGINX ingress controller service monitoring.
helm upgrade -i -n ingress-nginx ingress-nginx ingress-nginx/ingress-nginx \
--set controller.metrics.enabled=true \
--set controller.metrics.serviceMonitor.enabled=true
To verify whether things are going well, run this command.
kubectl port-forward --namespace prometheus svc/prometheus-operated 9090:9090
Open url http://localhost:9090, click on menu “Status -> Targets” and you should see “ingress-nginx-controller” in “UP” status.
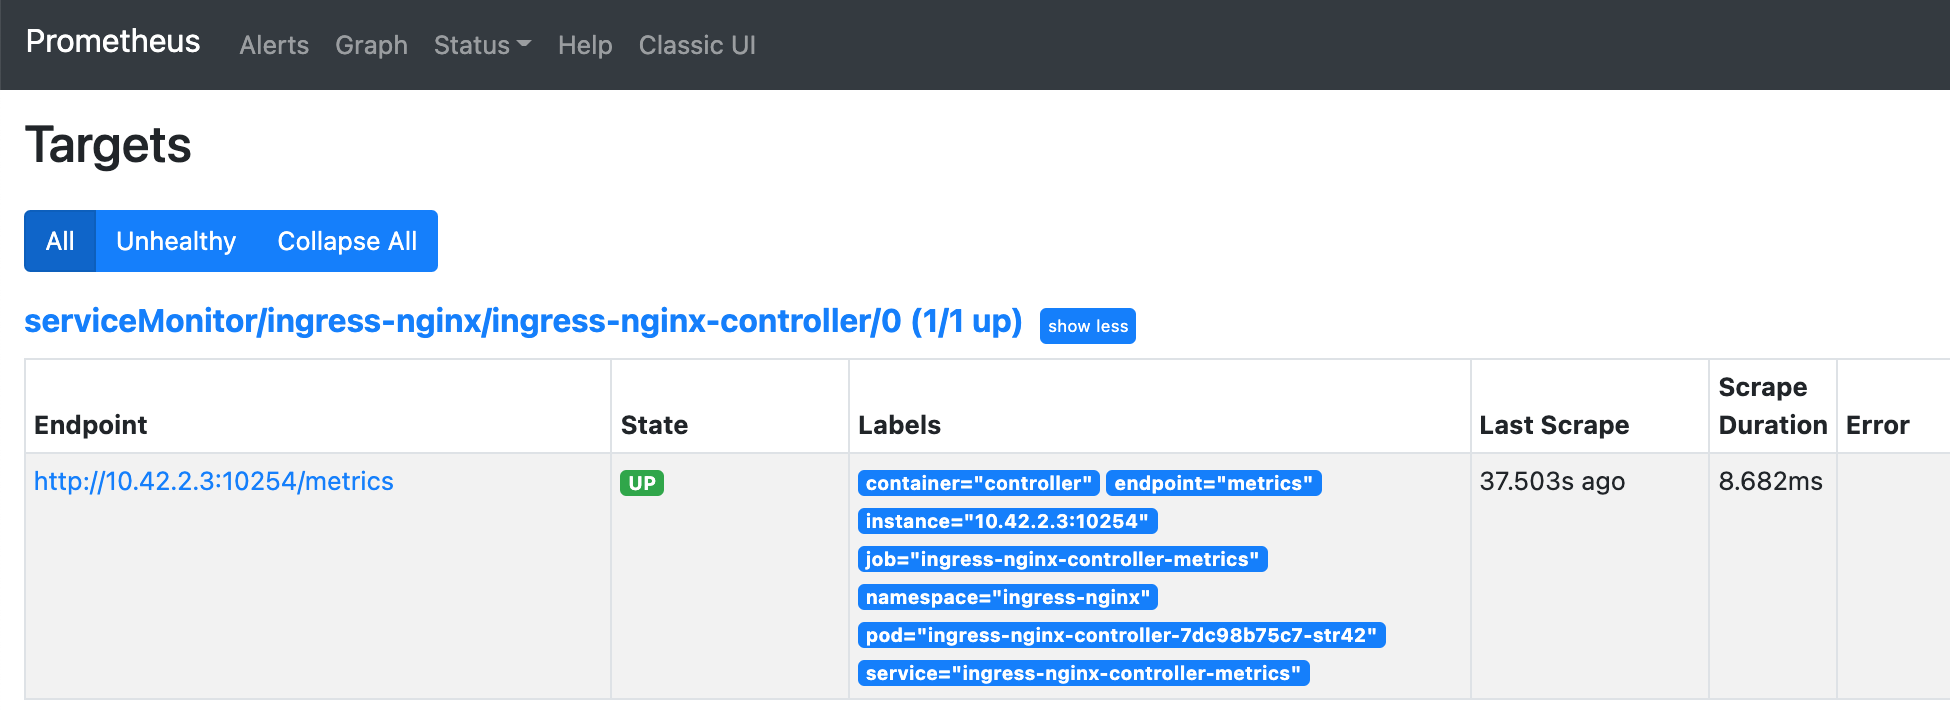 Prometheus UI shows nginx ingress controller status
Deploy demo application
In this demo, we will use the Canary deployment strategy to deploy a based version - Blue and Canary version - Yellow. We also add an analysis configuration saying that the application needs to has a success traffic rate more than 95% to automatically progress the Canary deployment, otherwise, it will be rollback. I will explain more in each step.
The deployment steps that will be covered in this demo are.
- Deploy a fresh demo application (Blue version)
- Deploy a Canary version (Yellow version)
- Inject the error and then automatic rollback
1. Deploy a fresh demo application (Blue version)
Run command below to perform a first time deployment.
kubectl apply -f ./prometheus-rollouts-demo
Note.
In addition to a normal Canary deployment, this command will install.
- analysis.yaml. A rollout resource described how to acquire the metric and also the failure condition. In the demo analysis, we query the demo application ingress success rate (status != 400 or 500) every 1 minute and it will result in failed status if the rate is less than 95% more than 3 times.
...
successCondition: result[0] >= 0.95
   failureLimit: 3
   provider:
     prometheus:
       address: http://prometheus-server.ingress-nginx:9090
       query: |
         sum(irate(nginx_ingress_controller_requests{service=~"{{args.service-name}}",status!~"[4-5].*"}>[5m])) /
         sum(irate(nginx_ingress_controller_requests{service=~"{{args.service-name}}"}[5m]))
Run this command to start Argo Rollouts dashboard.
kubectl argo rollouts dashboard
Open http://localhost:3100 to see the dashboard.
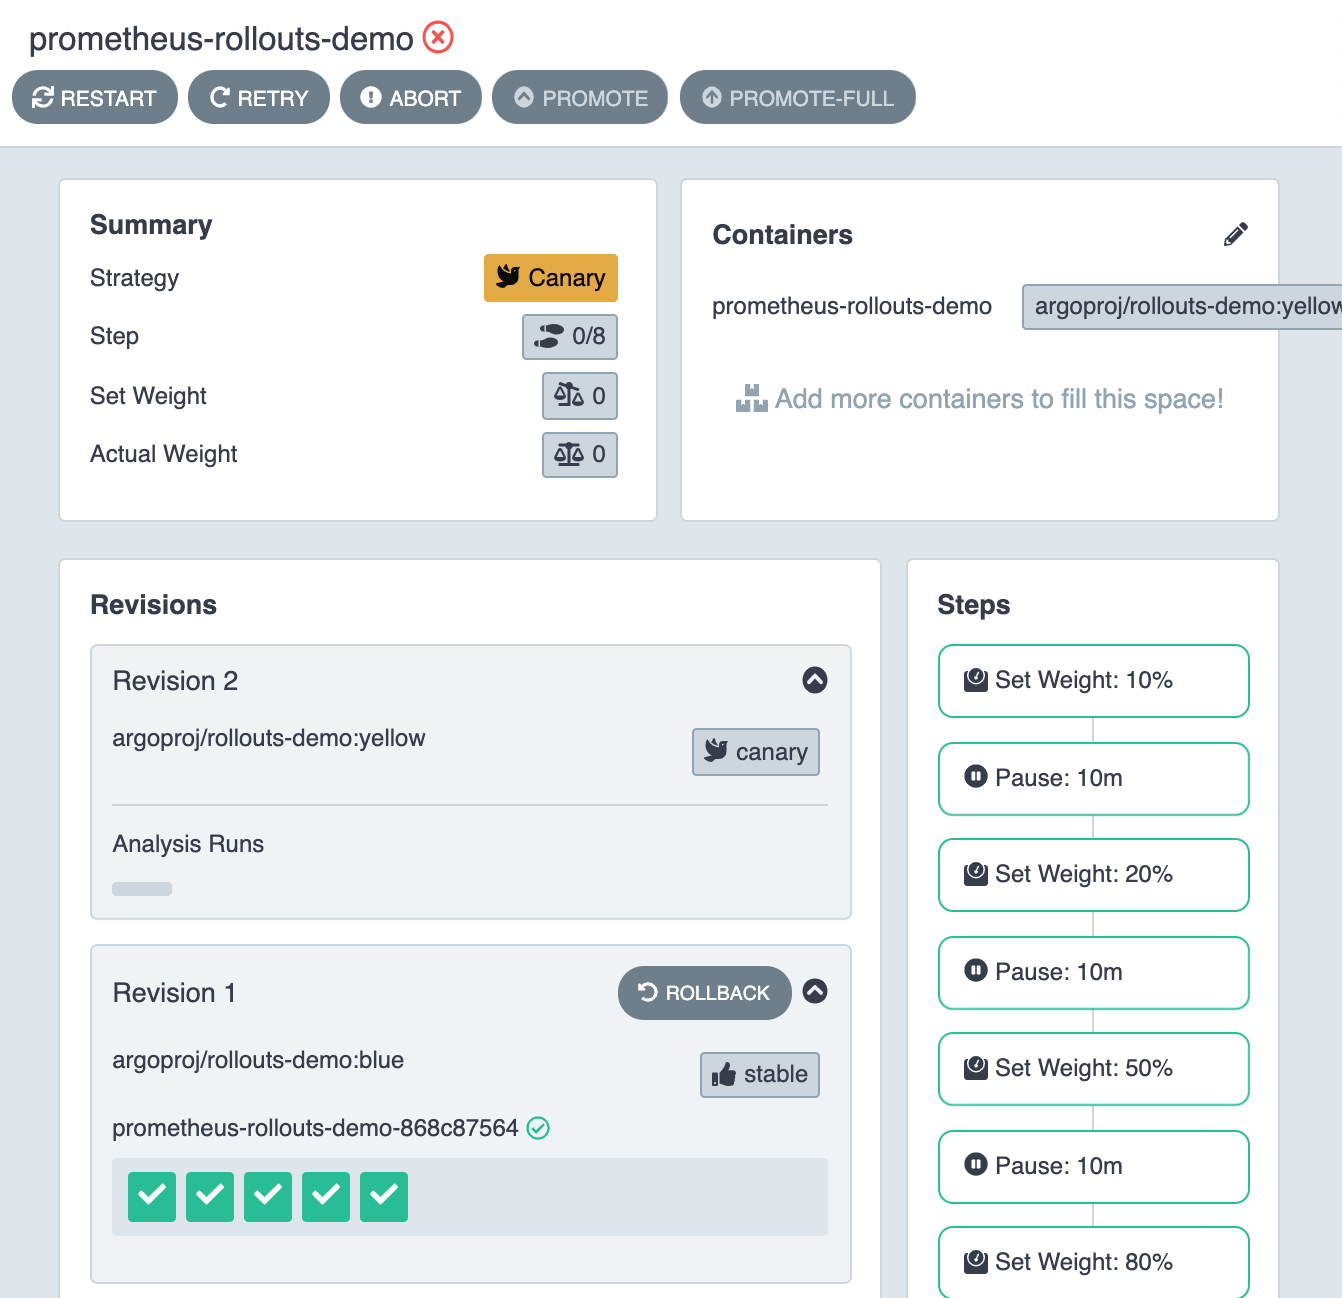
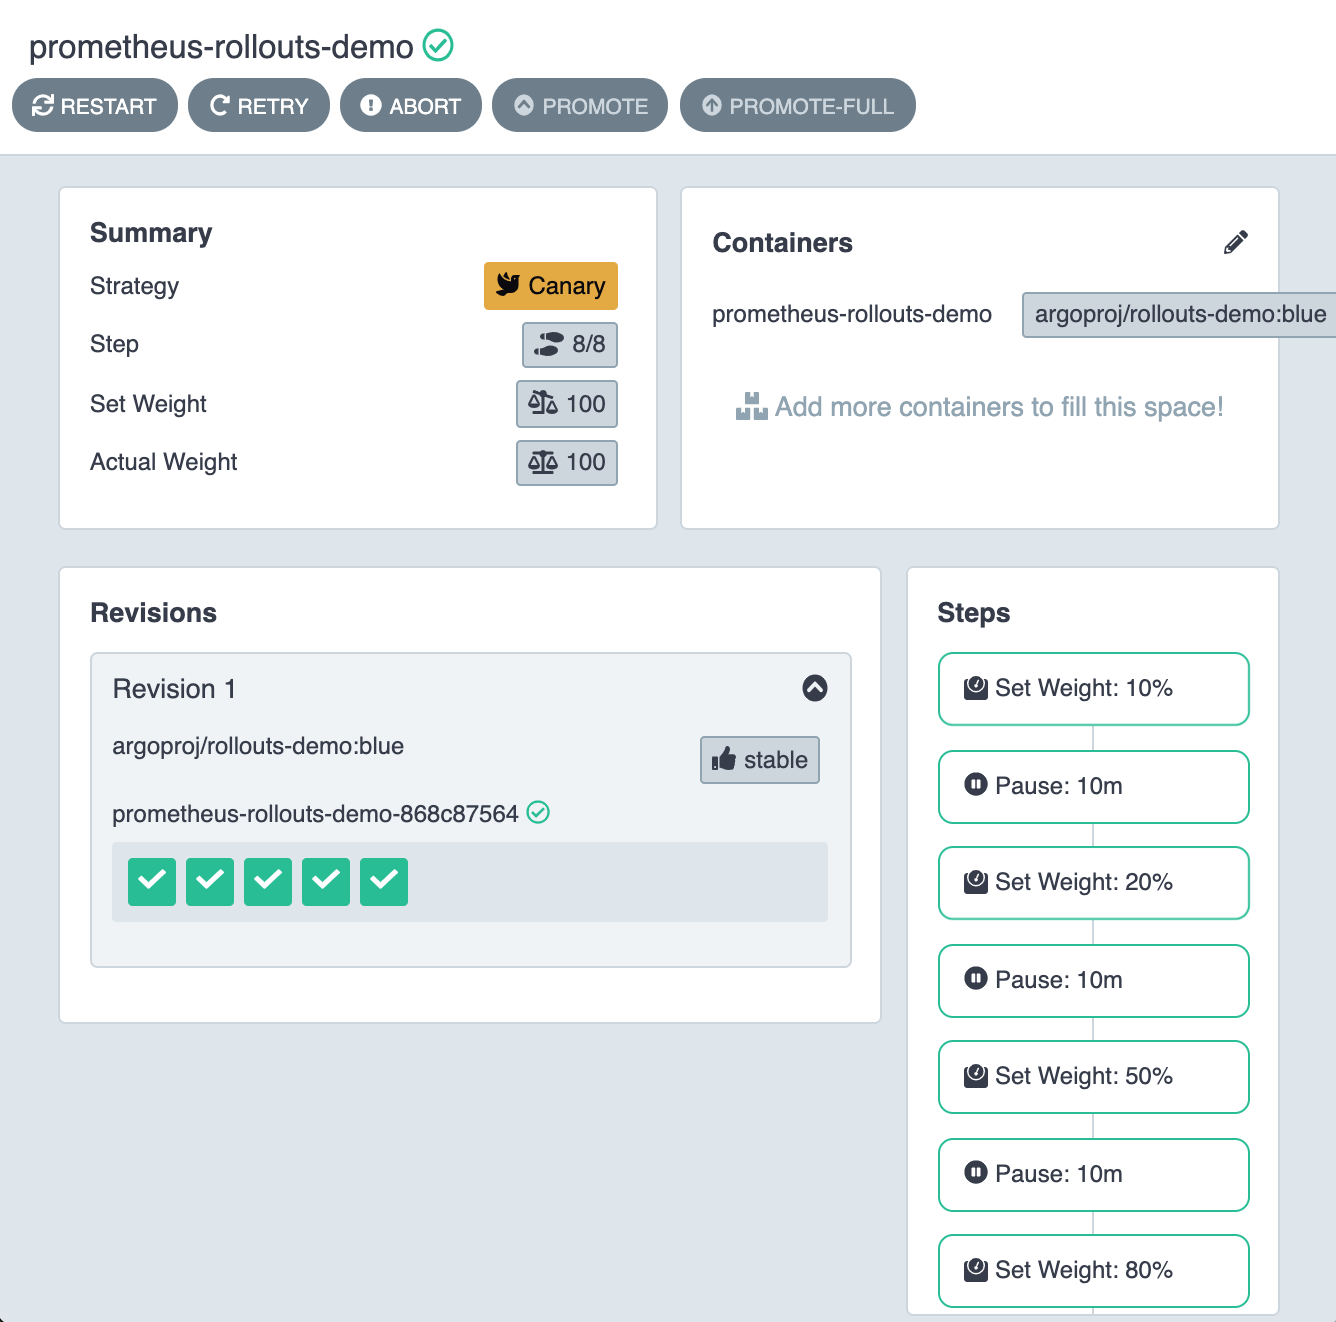 Dashboard UI the demo application started successfully
Open http://prometheus-rollouts-demo.192.168.1.61.nip.io to see “prometheus-rollouts-demo” and you should see.
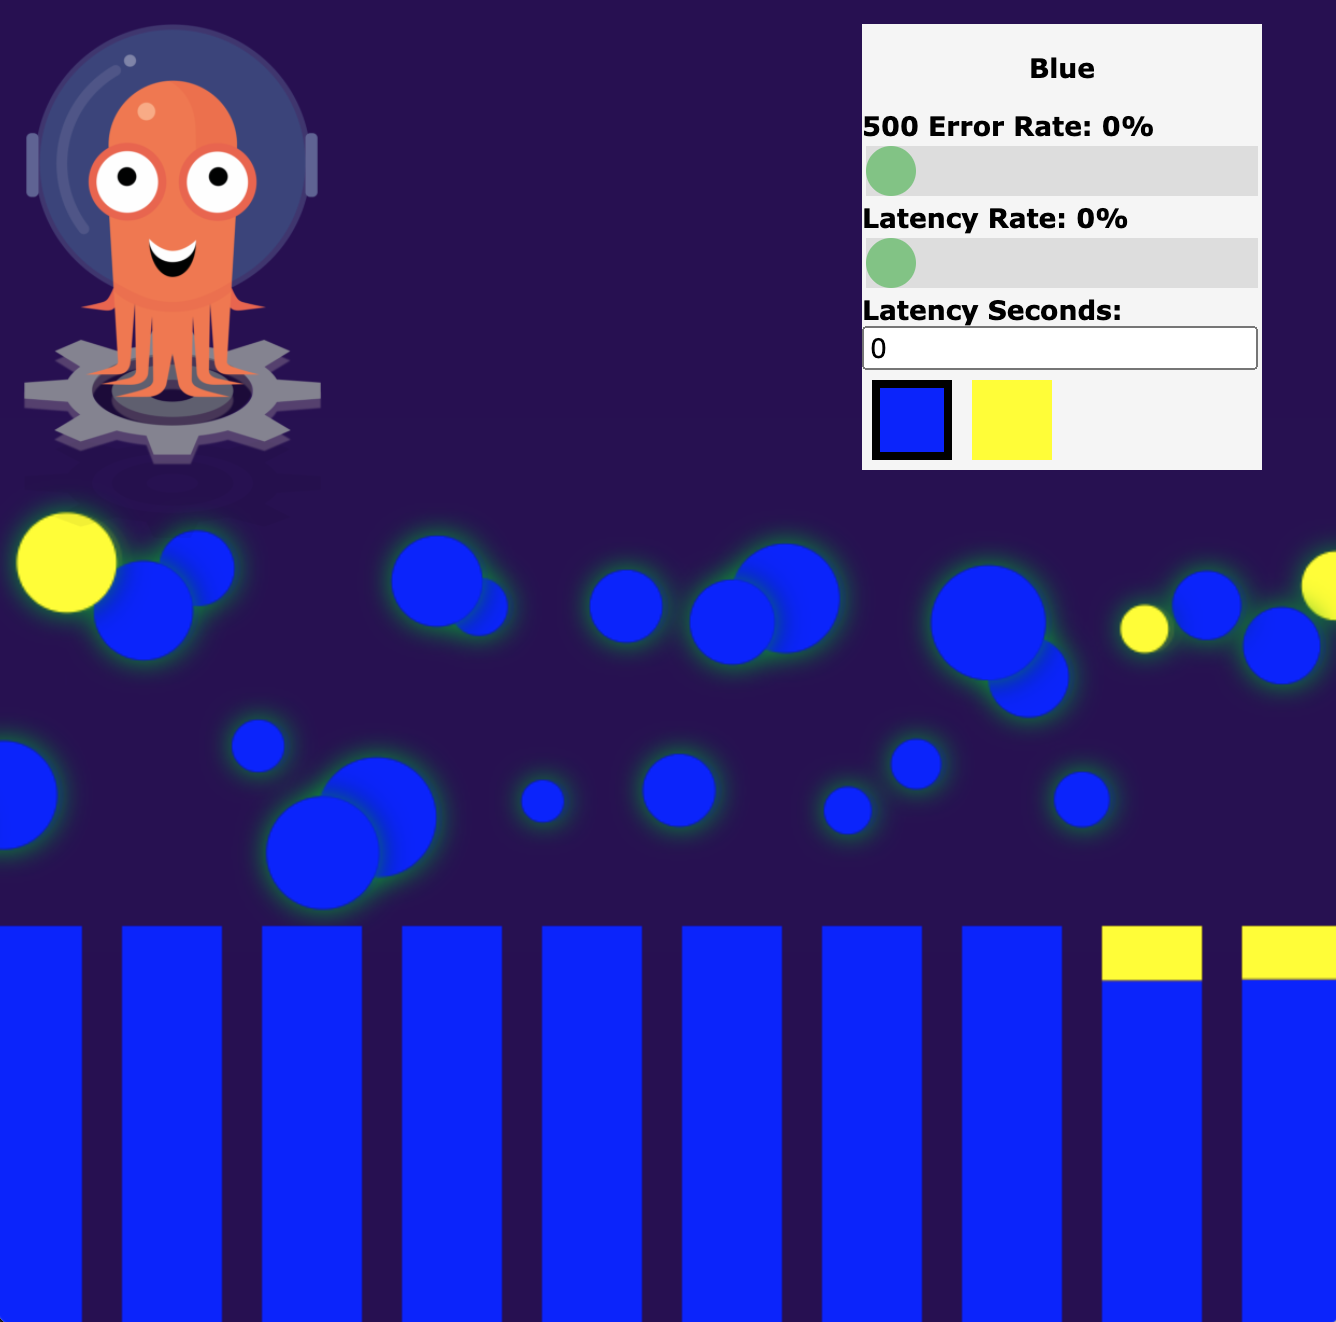
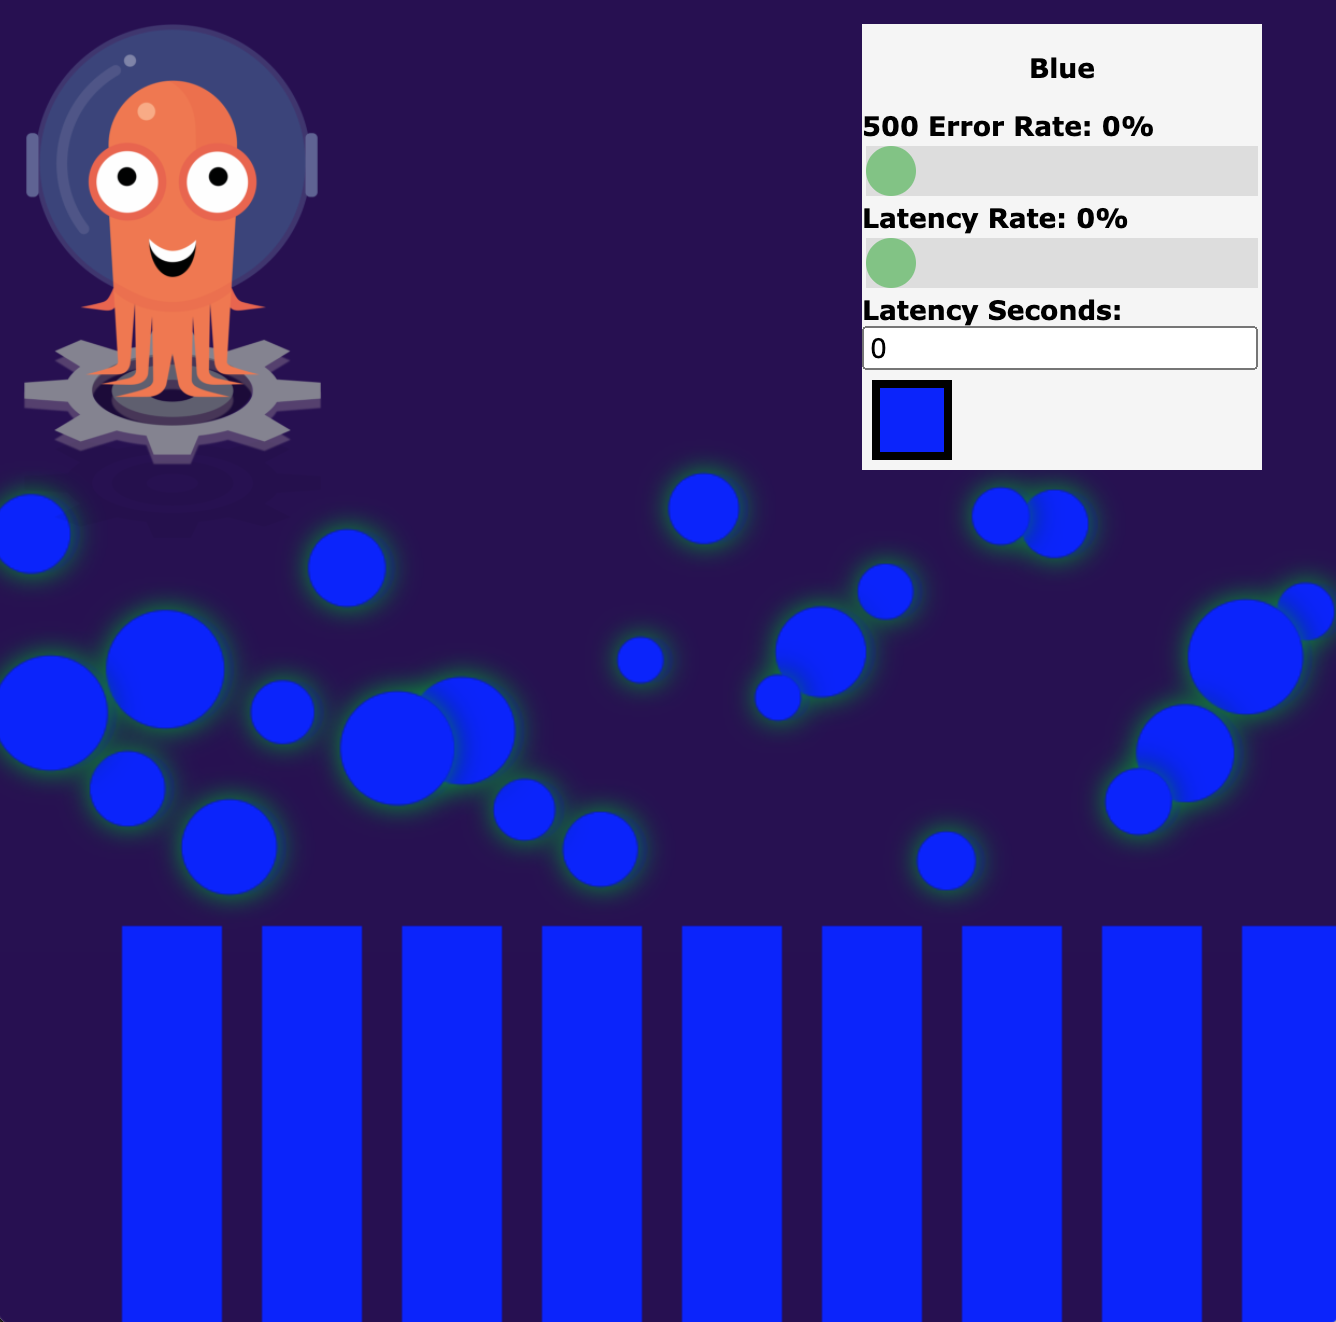 Argo Rollouts Demo Application showing 100% of traffic is Blue version
Note.
“192.168.1.61” is the Kubernetes master node IP address (if you create the cluster following this post). Any node IP address will work.
Open Prometheus UI by running.
kubectl port-forward --namespace prometheus svc/prometheus-operated 9090:9090
Open http://localhost:9090 and enter expression below.
nginx_ingress_controller_requests{ingress="prometheus-rollouts-demo"}
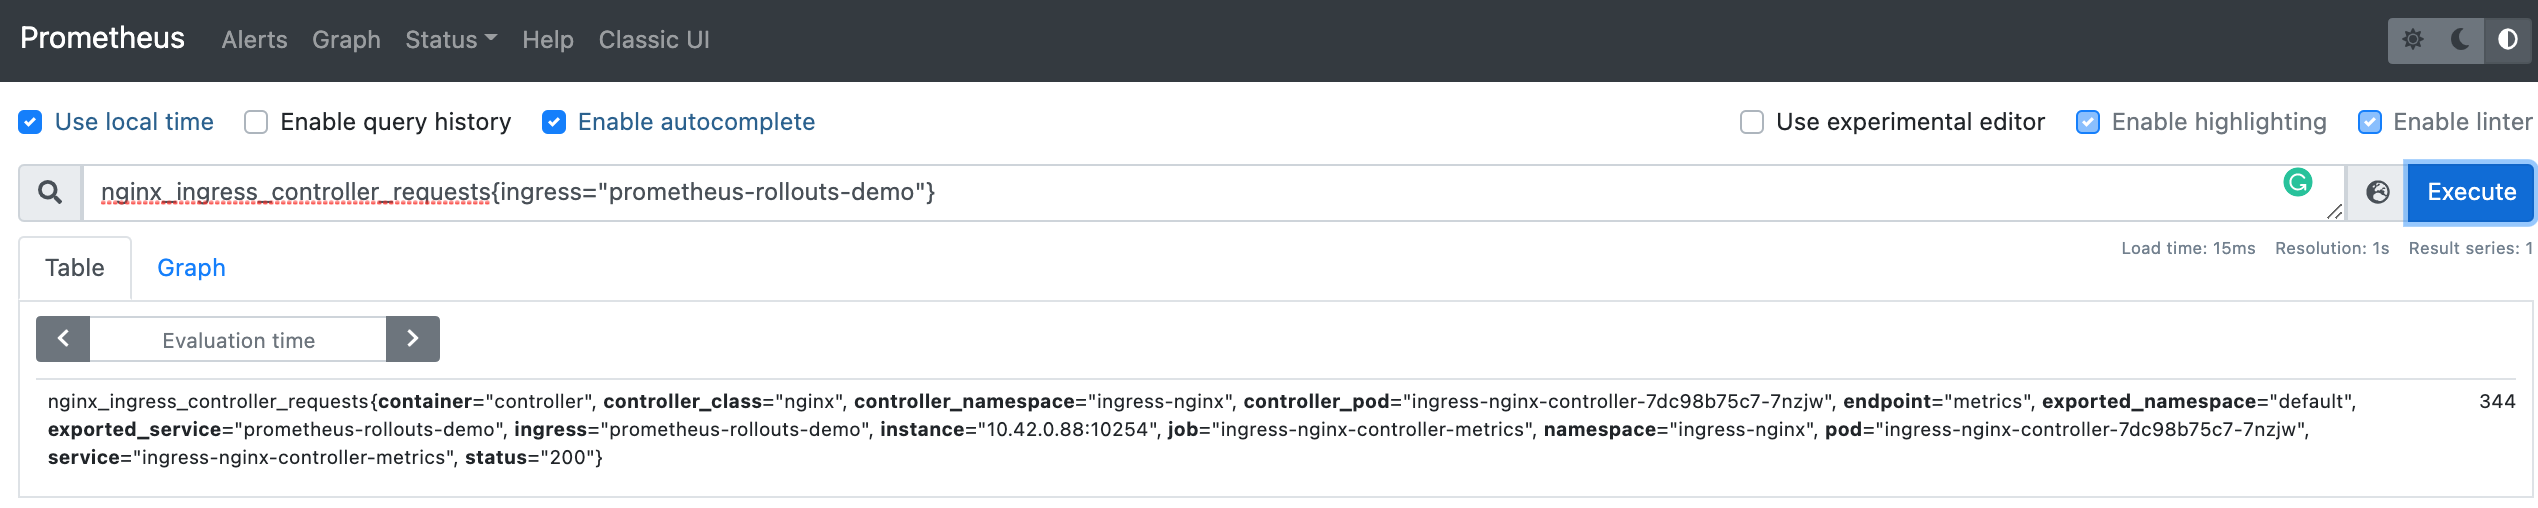 Prometheus UI shows our application ingress success metric (status = 200)
Note.
What is happening behind the scene.
- The demo application UI makes api calls to the backend through NGINX controller.
- NGINX controller records the incoming traffics.
- Prometheus server continuously scrape NGINX controller (/metrics) and stores states in the server.
- Argo Rollouts analysis service queries the Prometheus server using our defined query to determine success or failed analysis.
2. Deploy a Canary version (Yellow version)
Next, we will deploy the Yellow version as a Canary by updating ./prometheus-rollouts-demo/rollout.yaml to use Yellow version.
...
    spec:
      containers:
      - name: prometheus-rollouts-demo
        image: argoproj/rollouts-demo:yellow
...
Then, re-apply the application again.
kubectl apply -f ./prometheus-rollouts-demo
Open http://prometheus-rollouts-demo.192.168.1.61.nip.io and you will see that some traffic is already routed to Yellow version.
 Demo application shows some traffic routed to yellow version
3. Inject the error and then automatic rollback
Argo Rollouts demo application comes with an ability to inject the error rate from the UI.
Next, we will set “500 Error Rate” to 30% from the UI.
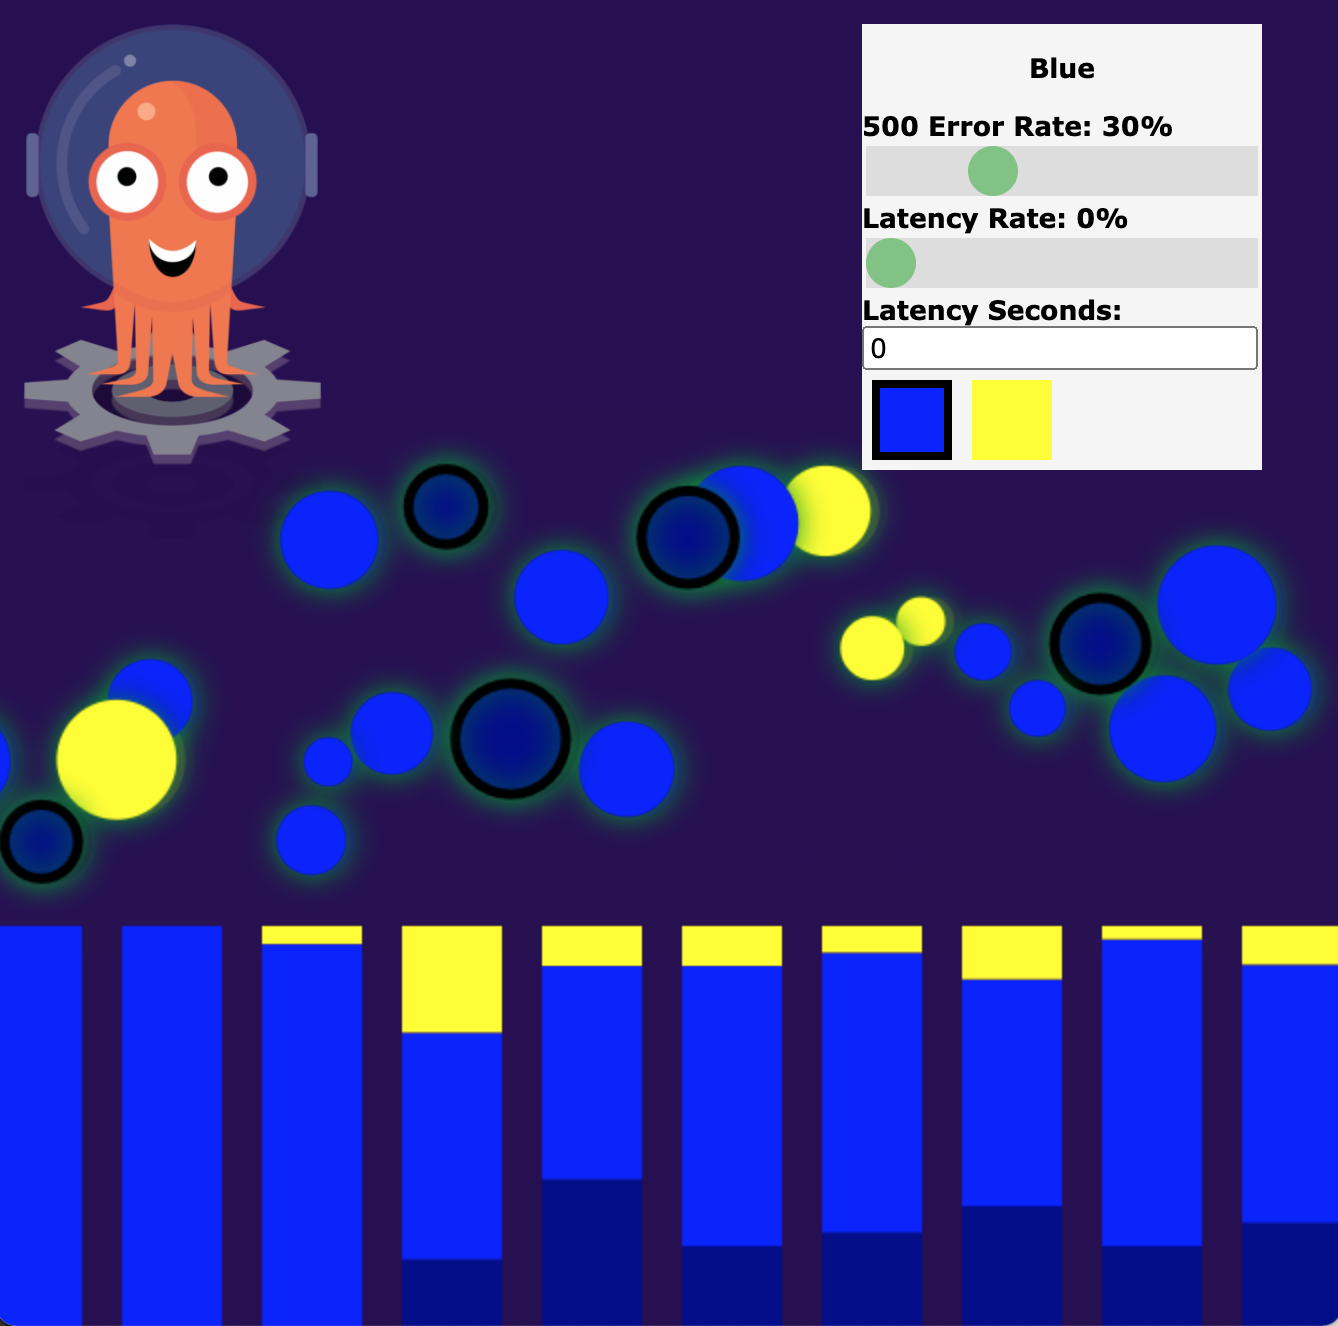 Demo application: set error rate to 30%
Go back to Prometheus UI (http://localhost:9090) and you will see that there is a 500 error metric added.
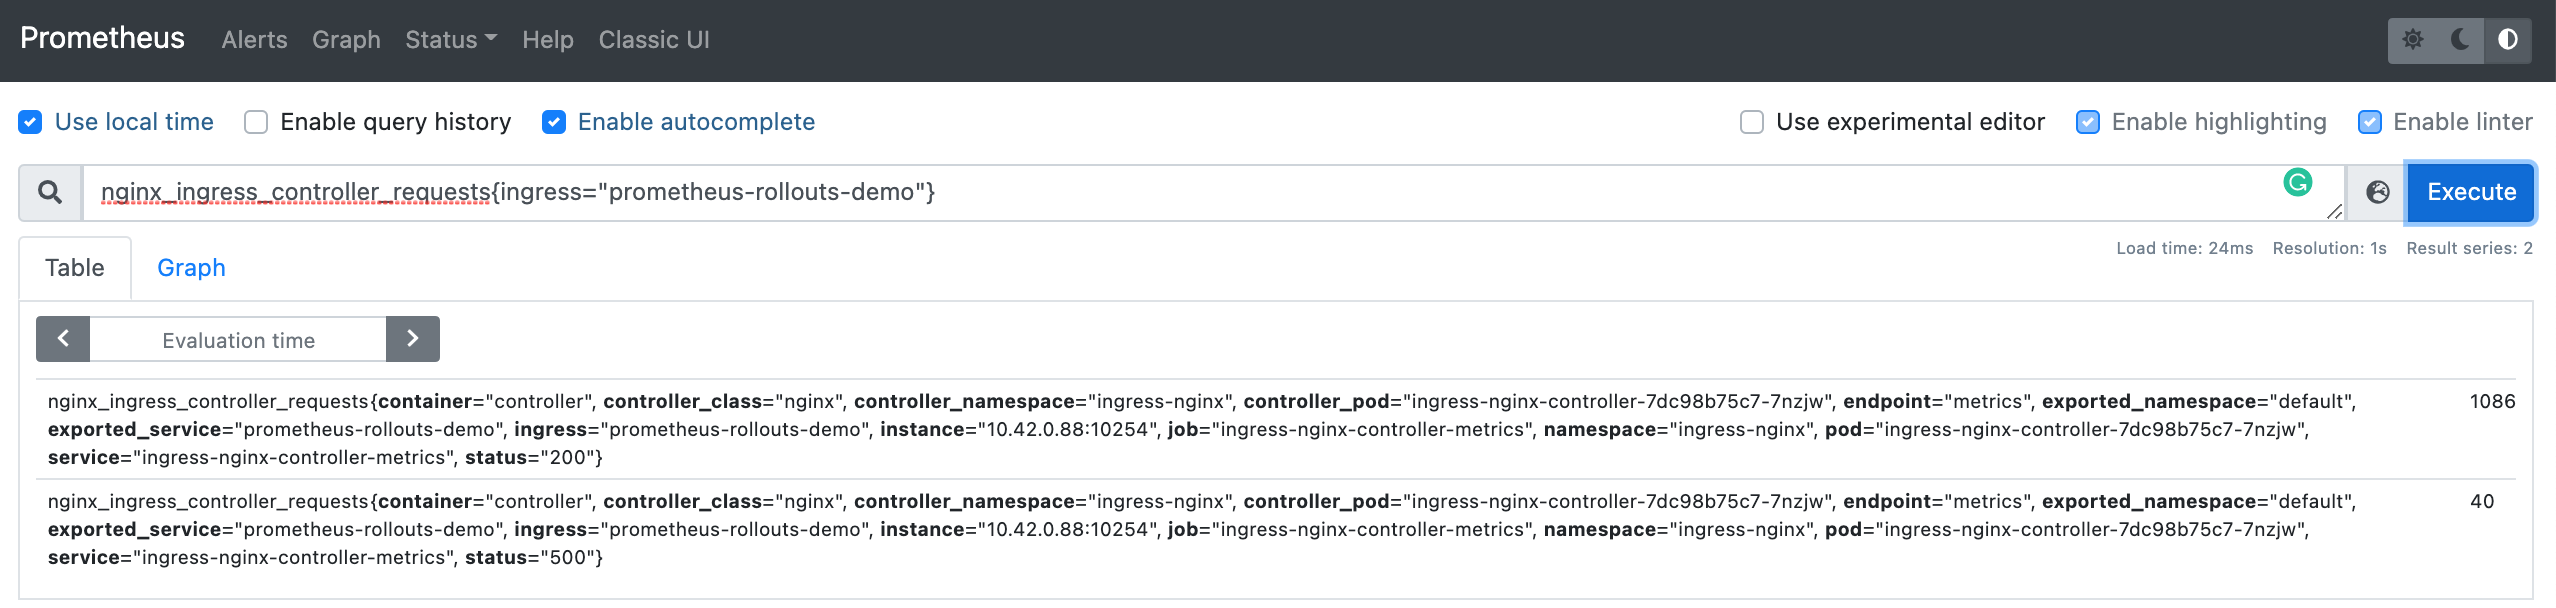 Prometheus UI shows our application ingress error metric (status = 500)
Wait for at least 3 minutes for the analysis to reach failed state 3 times.
On the dashboard, the analysis indicator will be grey out and the application will be rollback to 100% blue version.
 Dashboard UI the demo application rollback to 100% blue version
Conclusion
This post, you learned how to use Prometheus metric to rollback our application when something wrong happened. This is so powerful that we can control our deployment with the actual usage from the users automatically. Argo Rollouts and Kubernetes make this complex process much more simpler and this demonstrates the power of automation toolings in the software engineering world.